

适用对象:品牌广告主和小店卖家
TikTok小店分析工具
让你获得10倍增长的TikTok数据
一站式TikTok数据分析平台
包含带货达人、视频素材、TikTok小店、爆款产品数据
注册免绑卡

为什么选择Tikstar?
适用对象:TikTok达人和小店卖家
Tikstar协助你分析小店并发现爆款产品
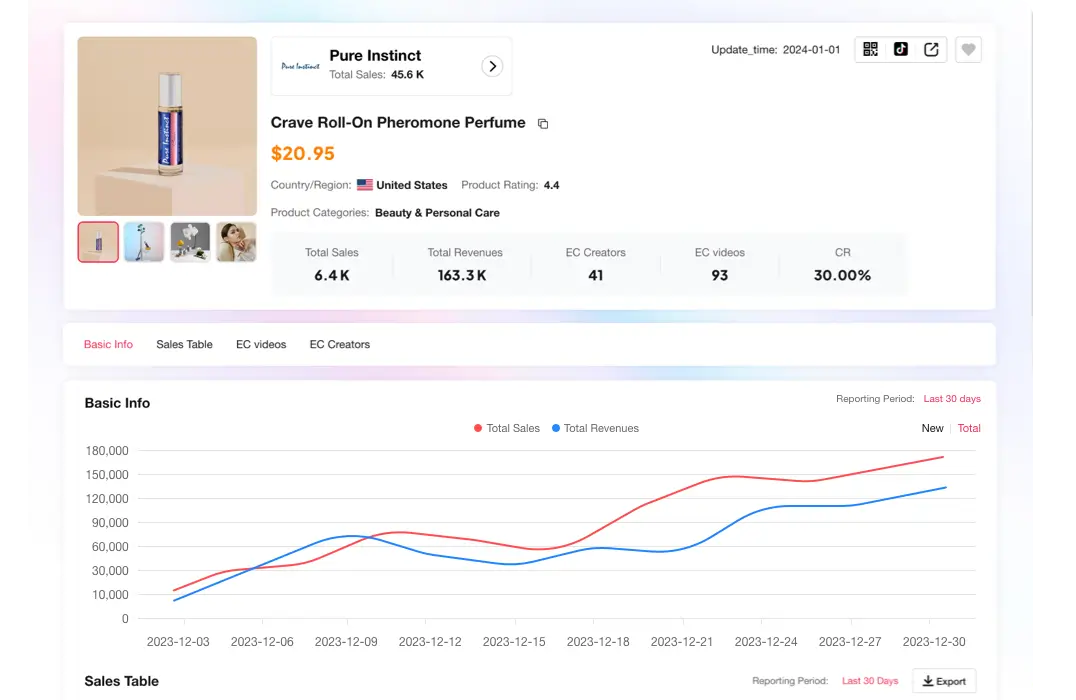
Tikstar还有哪些特色功能?
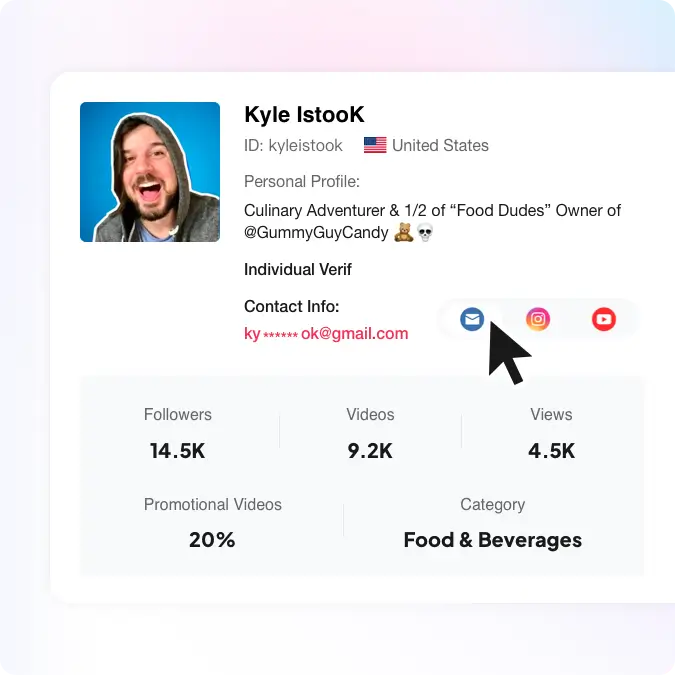
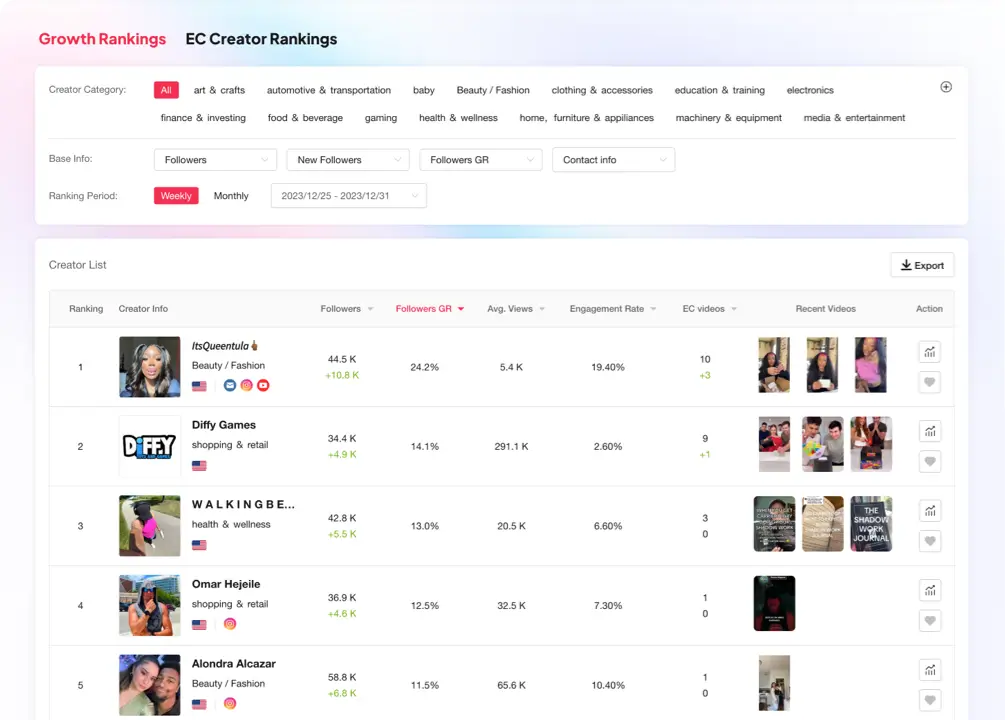
导出达人联系方式
提供达人的联系方式,包括邮箱、手机号、Ins、Twitter、YouTube等社媒账号信息。
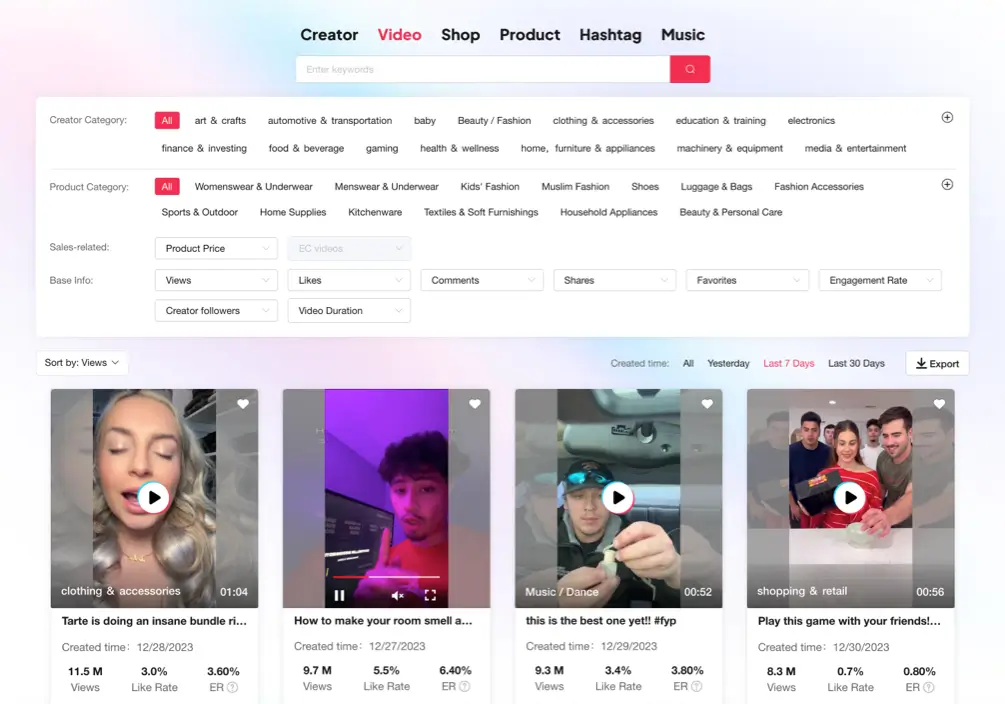
开始试用支持全方位多维的筛选功能
提供各种高效便捷的筛选维度,诸如价格区间、平均播放量、新增销量和增长效率等。
免费试用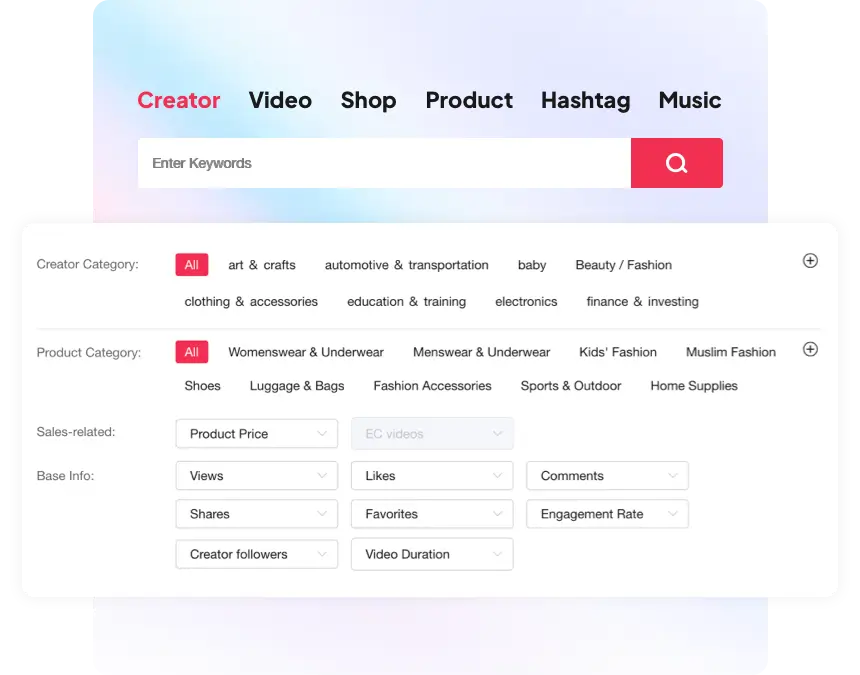
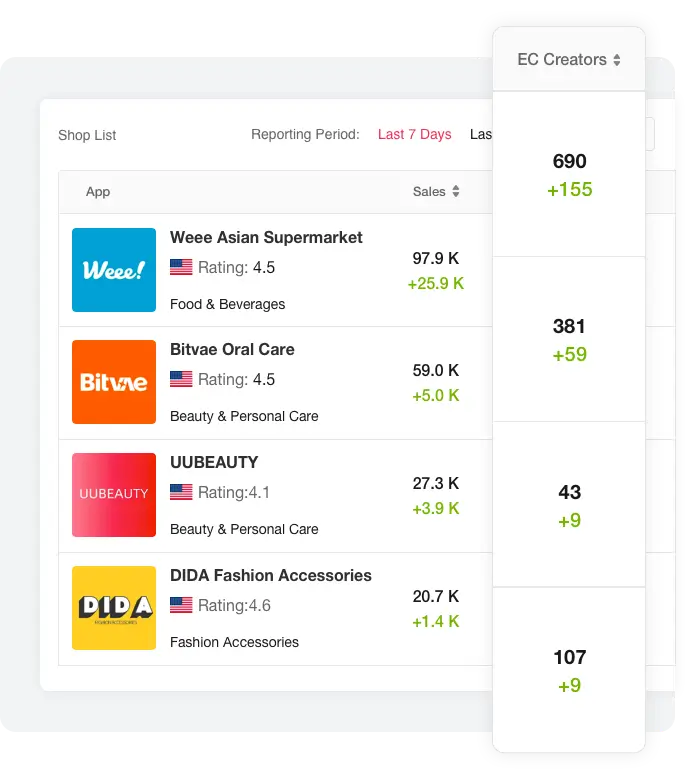
海量的带货达人数据
小店销量与达人数量之间存在强关联,更多的达人带货将促使你的小店销量持续增长。
开始试用包含更多功能


如果你每天的工作涉及大量的外联工作,并像我一样需要跟踪与达人的沟通进展,我强烈推荐尝试一下 Tikstar。他们允许你导出达人的联系方式。这些数据在市面上是挺稀缺的,他们允许导出,甚至还包括 Instagram 和 Twitter 的账号!这节省了我非常多的时间。

我可能是最早使用 TikTok Shop 的卖家之一。试了几款分析工具,但说实话,它们都差强人意。不过,Tikstar 绝对是个不错的选择。像在视频库中按价格范围进行筛选这样的功能,非常实用。我在其他地方都没见过这样的。所以,我很乐意向做小店的人推荐 Tikstar。

我有一只4岁大的边境牧羊犬,名叫托比(Toby),同时我也有一个 TikTok 账号。最初,我很难找到一种合适的方式来变现我的账号。对我来说,Tikstar 在解决这个问题上表现得非常出色。我真的很喜欢他们的达人详情页和产品页面,因为它们清晰地展示了类似我账号的TikTok达人是如何运营的。此外,我还可以从其他创作者那里获得创意灵感,解决了我许多创作上的挑战。